Why Sprint Burndown vs Release Burndown Charts Kill ROI
Key Takeaways
- The Micro vs. Macro Trap: A flawless sprint burndown simply proves your team can finish small tasks, but it completely ignores whether those tasks accumulate into a marketable product release.
- C-Suite Disconnect: Executives care about market delivery and budget utilization, not daily story point velocity. Relying on the wrong chart destroys stakeholder trust.
- Scope Creep Invisibility: Sprint charts reset every two weeks, hiding macro-level scope creep. Release charts expose the brutal reality of expanding epic requirements.
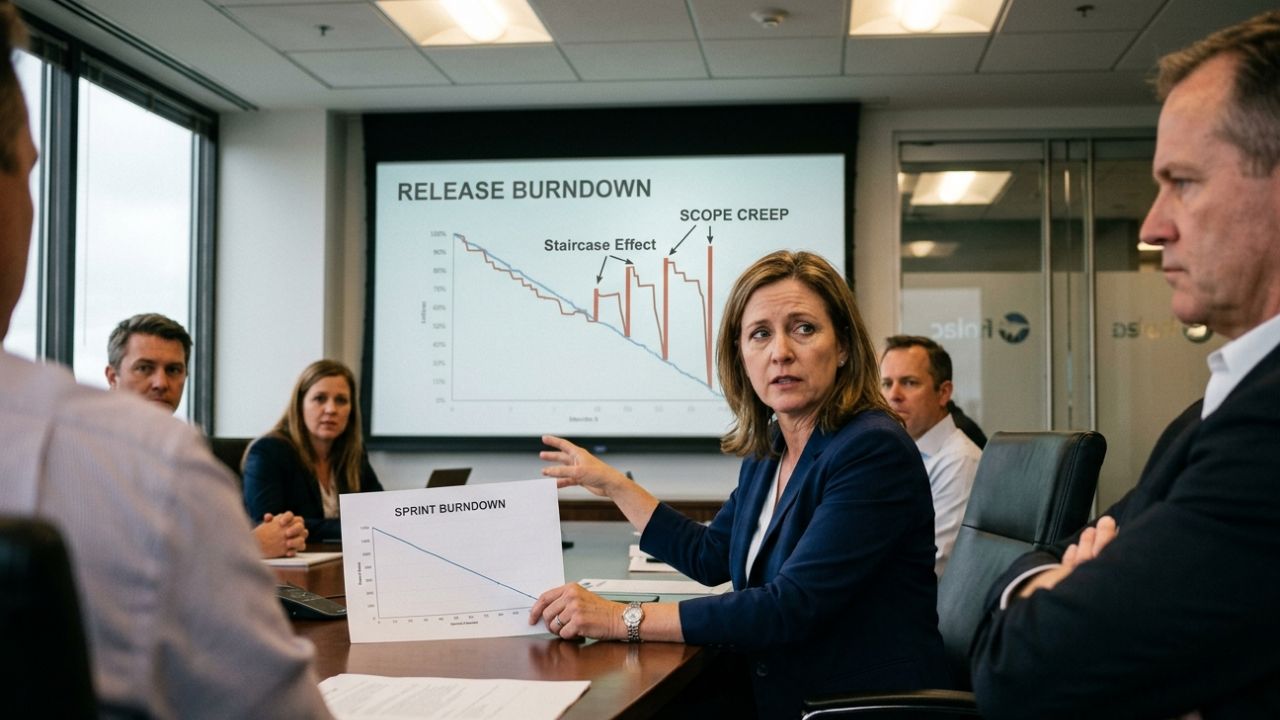
- The Staircase Effect: When new requirements are injected mid-release, your product timeline flatlines. You must track epic progress to maintain a positive return on investment.
- Product Owner Accountability: The Product Owner must own the release horizon to pivot budgets before a multi-month initiative becomes a sunk cost.
Product Owners face a harsh reality: a beautiful sprint burndown chart means nothing if the overall release is six months behind schedule.
Too many agile teams celebrate closing out their two-week iterations while the overarching product launch quietly spirals over budget and past deadlines.
Confusing daily progress with product health ruins budgets. Understanding the critical difference in sprint burndown vs release burndown charts is the ultimate defense against this catastrophic loss of Return on Investment (ROI).
When you only monitor the micro-level, you suffer from delivery myopia. To fix this, high-performing organizations rely on the advanced agile flow metrics framework experts hide to bridge the gap between daily engineering outputs and long-term business outcomes.
If you are a Product Manager or Scrum Master reporting to the C-suite, this deep-dive will explain exactly why focusing on the sprint horizon is killing your ROI, and how shifting to a release-focused tracking model will save your budget.
The Fatal Disconnect in ROI Tracking
To understand why ROI bleeds out during agile development, we must analyze the structural differences between these two visual management tools.
They measure entirely different dimensions of product health.
The Tactical Illusion of Sprint Progress
A sprint burndown chart tracks the remaining effort—usually in hours or story points—for a single iteration, typically lasting two weeks.
It is a highly tactical, microscopic view of development. When the line hits zero on Friday afternoon, the Scrum team cheers.
However, this chart tells you absolutely nothing about the market viability of what was just built. It simply confirms that the team did what they said they would do for ten days.
Celebrating a successful sprint burndown when the product is fundamentally behind schedule is like celebrating painting a cabin on a sinking ship.
The micro-goal was achieved, but the macro-investment is failing.
The Strategic Reality of Release Horizons
Conversely, a release burndown chart tracks the remaining work across multiple sprints leading up to a major product launch or Minimum Viable Product (MVP) delivery.
This chart measures actual product owner metrics. It encompasses entire epics, integrated features, and user journeys.
This is the only chart that reflects long term agile forecasting and actual capital expenditure.
If the release burndown is not trending downward, the business is burning cash without moving closer to a return on its investment.
How Tracking the Wrong Chart Ruins Budgets
When agile leaders use sprint burndowns to communicate progress to executive stakeholders, they create a dangerous false positive.
This misalignment is the root cause of agile project cancellations.
Masking Scope Creep at the Epic Level
Sprint burndown charts reset to a new baseline at the start of every single sprint.
Because of this reset, they completely mask long-term scope creep.
If stakeholders add three new epics to the product backlog mid-flight, the upcoming sprint burndown will not reflect this massive delay.
The team will pull in their standard velocity, and the sprint chart will look perfectly healthy.
Meanwhile, the release date just pushed out by three months. By the time leadership realizes the budget is exhausted, the ROI is already destroyed.
To expose this hidden scope expansion, many experts advocate pivoting to visual tools that explicitly separate scope from completed work. You can learn exactly how this functions by understanding the burnup vs burndown chart agile methodology.
The Infamous "Staircase" Effect
When you finally zoom out and look at a release burndown chart, you will often notice it doesn't look like a smooth downward slope.
Instead, it looks like a staircase.
The line drops slightly as work is completed, but then spikes straight up vertically.
This vertical spike represents scope being added to the release.
If your release burndown chart is a flat staircase—meaning the upward spikes of new scope perfectly cancel out the downward slopes of completed work—your ROI is zero.
You are paying an engineering team to run on a treadmill. They are working hard, but the product is not getting any closer to launch.
Shifting to Long Term Agile Forecasting
To protect agile ROI, Product Owners must elevate their tracking strategy.
Agile release planning requires stepping away from task-level micromanagement and focusing heavily on tracking epic progress.
Mastering Epic-Level Tracking
You cannot track a multi-million dollar release using granular sub-tasks. You must track at the Epic level.
During backlog refinement, the Product Owner must ensure that every user story rolls up cleanly into a designated Epic.
As sprints progress, the release burndown chart should actively burn down the cumulative story points of those Epics.
This provides a direct, unmanipulated view of whether the core business value is actually materializing.
Changing the Stakeholder Conversation
Stop showing sprint burndown charts in executive steering committees. C-suite leaders do not care about daily task completion;
they care about market delivery.
When you present a release burndown chart, you force a business conversation rather than an engineering conversation.
If the release chart is flatlining due to scope creep, the Product Owner can immediately ask the executive sponsor for a decision: "Do we increase the budget to accommodate this new scope, or do we cut features to protect the launch date?"
This radical transparency is what actively preserves ROI. It forces business leaders to confront the financial cost of their changing requirements in real-time, rather than acting surprised when the product fails to launch six months later.

Frequently Asked Questions (FAQ)
What is the difference between sprint burndown vs release burndown charts?
A sprint burndown chart tracks the completion of micro-tasks within a short 1-4 week iteration, showing daily engineering progress. A release burndown chart tracks the completion of macro-level epics and features over several months, showing long-term product health and trajectory toward a market launch.
Who is responsible for updating the release burndown chart?
The Product Owner is primarily responsible for maintaining the release burndown chart. While the Scrum Master handles daily sprint metrics, the Product Owner must ensure the macro-level backlog is accurate to provide stakeholders with realistic delivery forecasts and ROI projections.
How does a release burndown chart help Product Owners?
It empowers Product Owners to visually communicate the exact impact of scope creep to stakeholders. It clearly shows when added requirements jeopardize the final launch date, allowing the PO to make data-driven arguments for cutting scope or increasing budgets to protect ROI.
Can a sprint burndown chart predict the release date?
No. A sprint burndown chart cannot predict a release date because it only accounts for a tiny fraction of the overall product scope. It resets every two weeks, completely ignoring future epics, hidden dependencies, and newly added requirements that impact the macro timeline.
Why do release burndown charts look like a staircase?
Release burndown charts look like a staircase when new scope is continuously added to the project mid-flight. The line drops down as the team completes work, but then spikes straight up vertically when stakeholders inject new requirements, neutralizing the team's forward momentum.